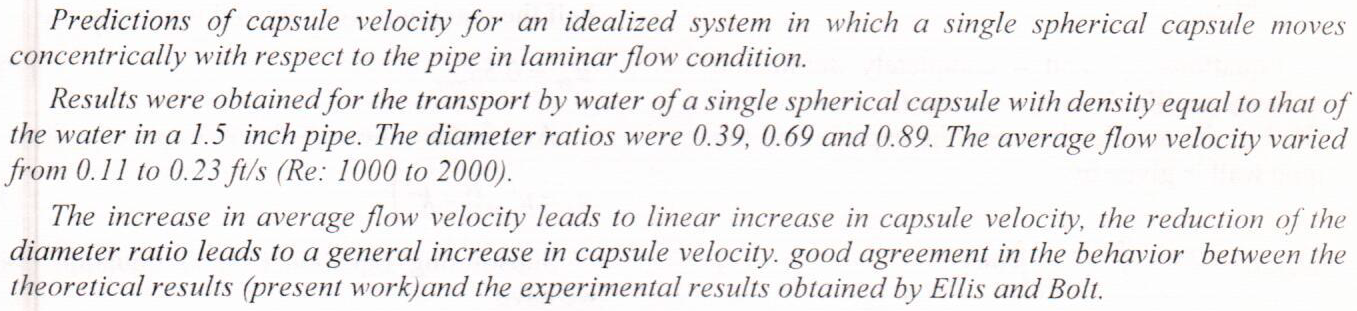
Theoretical Analysis of Concentric Flow of Spherical Capsule in Laminar Flow
This investigation aimed to explain the mechanism of MFCA by applying this method on air-cooled engine factory which was suffering from high production cost. The results of this study revealed that MFCA is a useful tool to identify losses and inefficiencies of the production process. It is found that the factory is suffering from high losses due to material energy and system losses. In conclusion, it is calculated that system losses are the highest among all the losses due to inefficient use of available production capacity.
In this paper, construction microwaves induced plasma jet(MIPJ) system. This system was used to produce a non-thermal plasma jet at atmospheric pressure, at standard frequency of 2.45 GHz and microwave power of 800 W. The working gas Argon (Ar) was supplied to flow through the torch with adjustable flow rate by using flow meter, to diagnose microwave plasma optical emission spectroscopy(OES) was used to measure the important plasma parameters such as electron temperature (Te), residence time (Rt), plasma frequency (?pe), collisional skin depth (?), plasma conductivity (?dc), Debye length(?D). Also, the density of the plasma electron is calculated with the use of Stark broadened profiles
In this work, a numerical study is performed to predict the solution of two – dimensional, steady and laminar mixed convection flow over a square cylinder placed symmetrically in a vertical parallel plate. A finite difference method is employed to solve the governing differential equations, continuity, momentum, and energy equation balances. The solution is obtained for stream function, vorticity and temperature as dependent variables by iterative technique known as successive over relaxation. The flow and temperature patterns are obtained for Reynolds number and Grashof number at (Re= -50,50,100,-100) (positive or negative value refers to aidding or opposing buoyancy , +1 assisting flow, -1 opposing flow) and (102 to 105) , respective
... Show MoreWater flow into unsaturated porous media is governed by the Richards’ partial differential equation expressing the mass conservation and Darcy’s laws. The Richards’ equation may be written in three forms,where the dependent variable is pressure head or moisture content, and the constitutive relationships between water content and pressure head allow for conversion of one form into the other. In the present paper, the “moisture-based" form of Richards’ equation is linearized by applying Kirchhoff’s transformation, which
combines the soil water diffusivity and soil water content. Then the similarity method is used to obtain the analytical solution of wetting front position. This exact solution is obtained by means of Lie’s
Computational study of three-dimensional laminar and turbulent flows around electronic chip (heat source) located on a printed circuit board are presented. Computational field involves the solution of elliptic partial differential equations for conservation of mass, momentum, energy, turbulent energy, and its dissipation rate in finite volume form. The k-ε turbulent model was used with the wall function concept near the walls to treat of turbulence effects. The SIMPLE algorithm was selected in this work. The chip is cooled by an external flow of air. The goals of this investigation are to investigate the heat transfer phenomena of electronic chip located in enclosure and how we arrive to optimum level for cooling of this chip. These par
... Show MoreIn this article, the nonlinear problem of Jeffery-Hamel flow has been solved analytically and numerically by using reliable iterative and numerical methods. The approximate solutions obtained by using the Daftardar-Jafari method namely (DJM), Temimi-Ansari method namely (TAM) and Banach contraction method namely (BCM). The obtained solutions are discussed numerically, in comparison with other numerical solutions obtained from the fourth order Runge-Kutta (RK4), Euler and previous analytic methods available in literature. In addition, the convergence of the proposed methods is given based on the Banach fixed point theorem. The results reveal that the presented methods are reliable, effective and applicable to solve other nonlinear problems.
... Show MoreProduction logging is used to diagnose well production problems by evaluating the flow profile, entries of unwanted fluids and downhole flow regimes. Evaluating wells production performance can be easily induce from production logs through interpretation of production log data to provide velocity profile and contribution of each zone on total production. Production logging results supply information for reservoir modeling, provide data to optimize the productivity of existing wells and plan drilling and completion strategies for future wells. Production logging was carried out in a production oil well from Mishrif formation of West Qurna field, with the objective to determine the flow profile and fluid contributions from the perforations af
... Show MoreProduction logging is used to diagnose well production problems by evaluating the flow profile, entries of unwanted fluids and downhole flow regimes. Evaluating wells production performance can be easily induce from production logs through interpretation of production log data to provide velocity profile and contribution of each zone on total production. Production logging results supply information for reservoir modeling, provide data to optimize the productivity of existing wells and plan drilling and completion strategies for future wells. Production logging was carried out in a production oil well from Mishrif formation of West Qurna field, with the objective to determine the flow profile and fluid contributions from the perforations af
... Show More